


Graphical stats on appoinments and booking revenue in dashboard
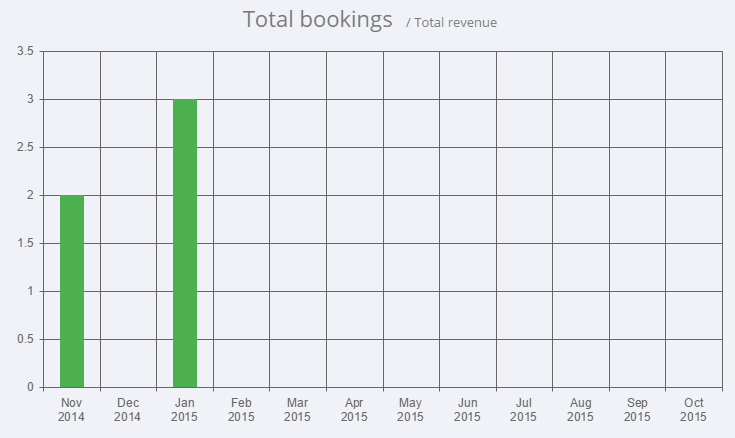
We have added a few very interesting graphs into the company dashboard of our users. In these graphs you can see various information about bookings, revenue, workload and client attendance. Furthermore you can look at bookings and revenue per provider or per all providers. You can also pick out certain providers to see only their statistics.… Read More »